From the Experience Graph to the Skill Graph

Back on August 14 Gary Golden wrote a fascinating post on Techcrunch “Why LinkedIn should kill the résumé and replace it with the experience graph.” He makes the basic point that the résumé as it currently exists does not do a good job serving any of the functions it is supposed to fill.
What functions are those? The main one is in job applications. At some point in our careers most of us have sent off a résumé hoping against hope that it will somehow standout against the 100s, these days 1,000s of others. Does anyone think their résumé gives a good picture of who they are? Or that flipping through résumés will help you find the people that will change up your team? Résumés and systems that rely on them, like most applicant tracking systems, are not the solution. Your LinkedIn profile looks a lot like, well, your résumé with the main value add being your connections. It is useful to know who a person knows, but I ask you, how well do you know most of your LinkedIn connections?
There are other uses for the résumé. Many professional services firms keep updated (sort of) résumés on file for their consultants and package these up as part of proposals or request for proposal (RFP) responses. At some firms résumés are even used as a sort of informal skill repository and if a project planner or resource allocator wants to find a person with a specific skill they search against a database of résumés. Sometimes this even gives results. But these standalone document repositories cannot show the whole picture of a firm’s capabilities, help leadership to find skill gaps, or individuals build their own skills. They are passive documents, filed and forgotten.
Gary Golden proposes the ‘experience graph’ as an alternative. The experience graph is a record of the many experiences we have that lead to our learning something. Think of something you have learned recently. Your learning was probably the outcome of many different experiences: conversations with people, relationships you formed, articles you read, blog posts you wrote, explanations and help you gave to others, reports you wrote or code you typed. Learning is the product of many different experiences. It is the experiences that validate a résumé, make it come to life, and connect it to life.
The experience graph is the data record from Tincan, or xAPI as it is now known. This project grew out of the learning community’s interest in informal learning, led by SCORM (an old learning standard) experts Tim Martin and Mike Rustici. Technically it is a data format for storing data about learning experiences and is intended to replace the data storage function of learning management systems (those enterprise software applications that record formal learning and certifications). These data records are collected into learning record systems (LRS).
Learning records are not the end goal. At TeamFit, we see learning records as one of many types of skill evidence. Our platform is built around four core constructs that we weave together into the skill graph. The skill graph connects data about people, roles and projects with skills. It is designed to answer questions line …
What skills does Karen use when she works with Steven?
Who does Kasumi usually work with?
What skills does Lee apply to Design Thinking projects?
What are the typical roles on a design-thinking project?
What skills are associates with successful environmental reclamation projects?
These are all critical questions for people leading professional services organizations or building teams to deliver projects to clients.
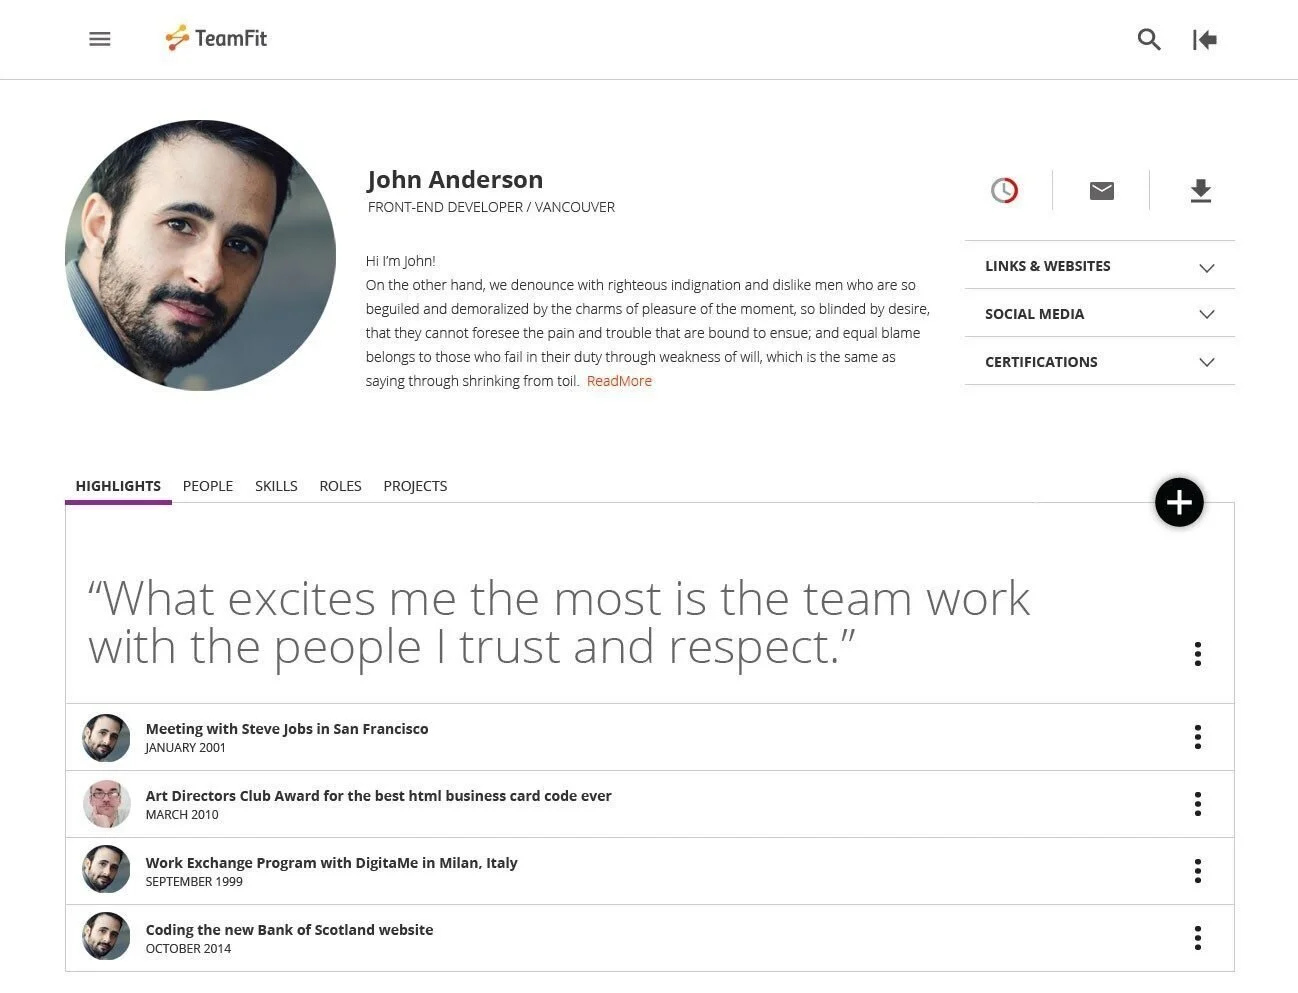
Conversations about people, roles, projects and skills are critical to business success, but they are not the whole picture. As people we like to tell stories. So in the new TeamFit, we are building personal profiles around stories, or as we call them, highlights. Have you ever been in an interview and asked someone to tell you about the highlights of their career (or their trip, or their studies, or their relationship)? We are organizing the personal profile around ‘highlights.’ You can see this from the screen shots below, which come from TeamFit V2.
A ‘highlight’ can of course lead to a person, a project a role or a set of skills. One of the highlights of my own career was sitting down with Chris Argyris and building a model of learning, and barriers to learning in an organization. This was for a project, I was working with other people, in the role of VP Online Solutions at Monitor Group (now Monitor Deloitte) and applying Active Listening, Critical Thinking, Systems Design, Formal Modeling and other skills.
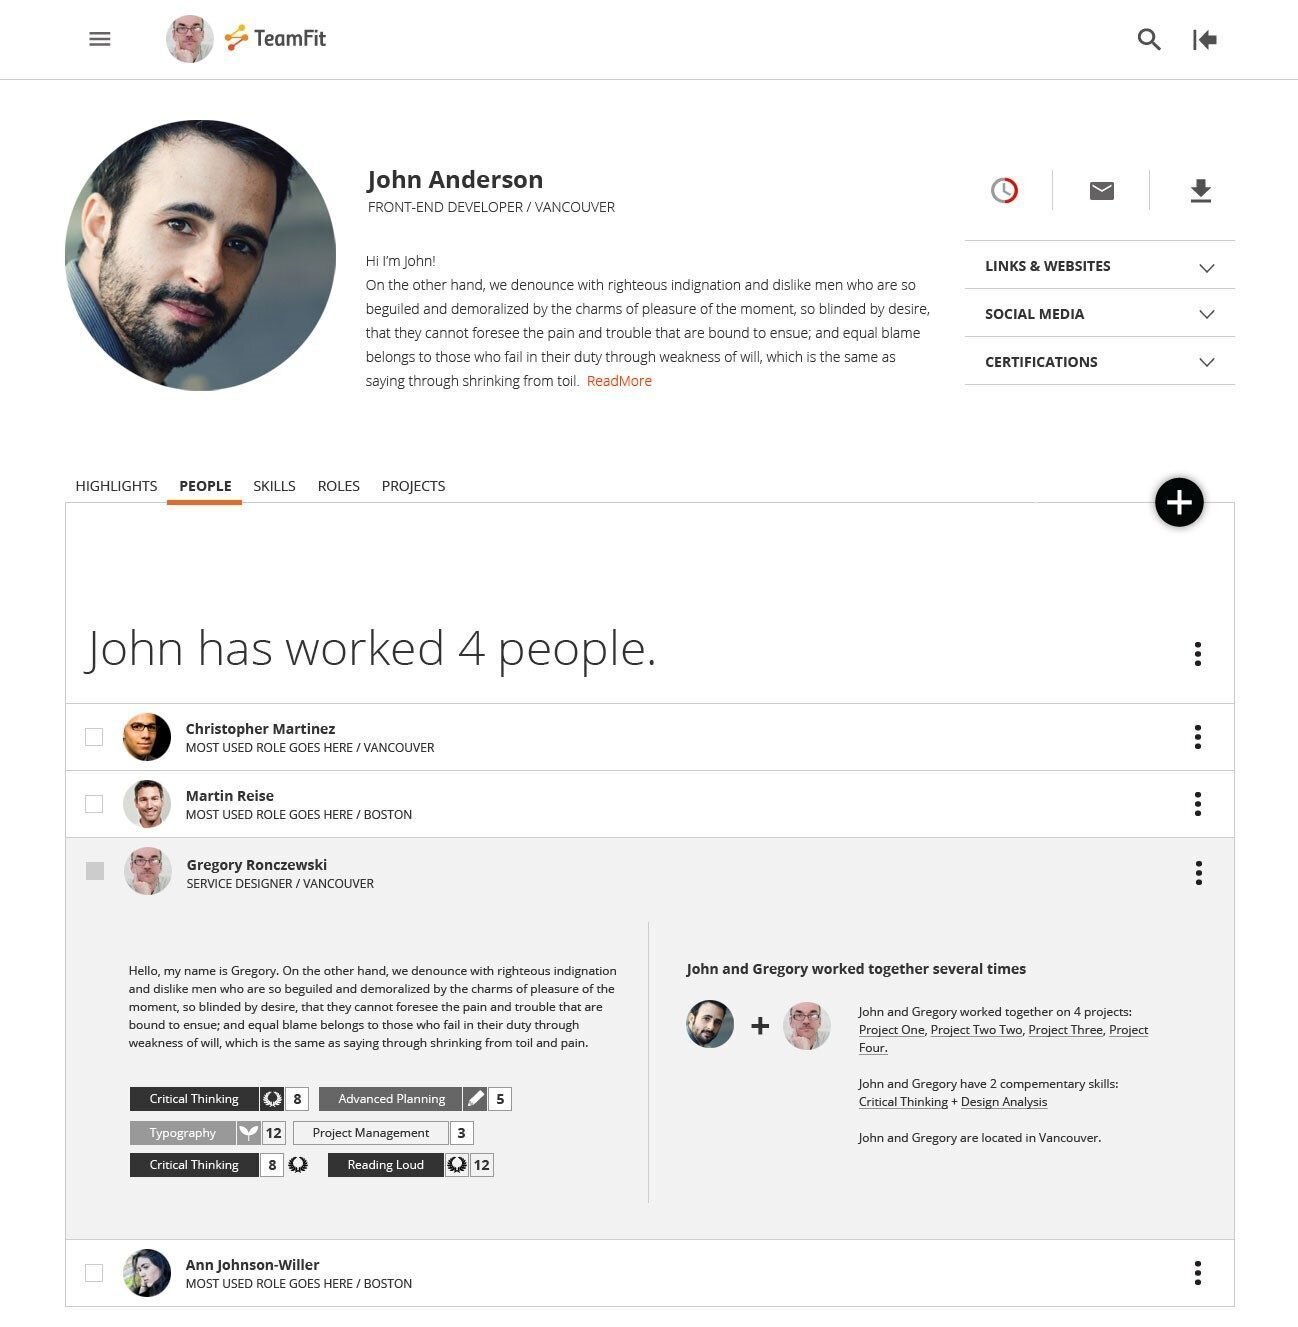
From ‘highlights’ I can go easily to see the people John has worked with (see below), the skills he has, the roles he has held and the projects he has worked on. This data comes from many places – integrations with HRIS and project management systems, social media and social interactions.
Collecting your learning experiences and storing them in a learning experience repository is a great place to start. TeamFit can integrate with these repositories. But work is about a lot more than learning. We need to get from learning to the skills people have that they can apply in teams to deliver projects.
We are looking for the person who created the top image. There are a lot of images in this style on the web, we would like to find the person who created them. Please let us know.
